5 critical end of year marketing evaluation

5 Critical End-of-Year Marketing Procedures You Can't Afford to Skip

Step-by-Step Guide to End of Year Strategic Marketing

As Q4 winds down, most marketing teams fall into one of two camps: those scrambling to burn through remaining budgets, and those moving through the end of year assuming the heavy lifting is already done. The final weeks of the quarter aren't just a wind-down—they are your springboard to a new business year. A detailed end-of-year marketing procedure is your difference between entering a new year on the defensive or hitting the ground running with a new detailed budget and a clear ROI roadmap. The time is now to start your new year with a step-by-step playbook every marketing team needs to audit past campaigns, remove wasteful spending, and a strategic marketing  plan for scalable growth in the year ahead.

Consistently tracking your monthly and quarterly metrics makes year-end planning strategic and systematic. Instead of starting from scratch, you can use past performance data to quickly evaluate what worked, discard what didn't, and set a confident direction for next year.

Marketing keywords and geographical trends

Depending on your specific business class and product offerings, trends and keywords may change yearly, quarterly, and occasionally monthly.

Start by analyzing past and current trends. Because your product lines may be impacted by multiple overlapping trends, categorizing them by audience and demographics can reveal untapped customer segments during your review. A quick way to spot these shifts is by using Google Trends (trends.google.com) to compare last year’s search volume against its current path. Include the time it takes to project new trends and new locations, widening your previous customer base and adding additional demographics to your previous year.

Keywords touch nearly every corner of your digital marketing stack—powering organic SEO rankings, paid advertising targeting, social media hashtags, landing pages, and blog content. Modern keyword management requires tracking both performance and search intent. While dedicated platforms like Semrush, Ahrefs, and Google Keyword Planner streamline data collection, maintaining a centralized keyword tracker (in Excel, Google Sheets, or your CRM) gives your team a single source of truth.

In your tracker, document key metrics sourced directly from your SEO tools:

  • Core Keyword & Search Intent: Informational, commercial, transactional, or navigational.
  • SEO Metrics: Monthly search volume, Keyword Difficulty (KD), and competitive density.
  • Audit & Asset Tracking: Date last checked, current organic position (via Google Search Console), and where the keyword was last deployed in ad copy or blog posts.
  • Hashtag’s: Defined for distinct social media products and demographics. (ritetag.com)

Monitoring these factors helps you spot declining organic traffic, catch changes in search algorithms, and identify quick-win opportunities to update existing content. Long-term tracking over the years of this information helps to define new targets in the following years. Include this information, not only in your upcoming marketing plan but for years to come.

Demographics

Once you’ve audited your trends and keywords, the next critical step in your end-of-year review is evaluating who actually engaged with your marketing over the last twelve months. Even the best-written content and highest-bidding keywords will underperform if they aren't reaching the right audience.

Simply put, demographic tracking breaks down your audience by location, age, interests, and behavioral traits. While these core segments stay relatively stable, conducting a year-end check using your paid ad and social analytics ensures your campaign targeting reflects real-world performance rather than assumptions.

When evaluating your demographic data at the end of the year, focus on three key areas:

  • Target vs. Actual Conversions: Compare your initial buyer personas against the specific audiences that actually drove revenue this year.
  • Platform-Specific Shifts: Identify whether certain demographics performed significantly better on specific channels (e.g., LinkedIn vs. Meta).
  • Emerging Segments: Spot unexpected demographic groups that began engaging with your content so you can build dedicated campaigns for them in Q1.

Auditing this data now guarantees your team enters the new year with optimized targeting parameters and zero wasted ad spend.

Beyond evaluating trends, keywords, and demographics, your end-of-year procedure must include a deep dive into your Key Performance Indicators (KPIs)—the measurable metrics that prove marketing ROI, such as Customer Acquisition Cost (CAC), Return on Ad Spend (ROAS), and conversion rates. However, a true year-end KPI audit isn't just about checking whether you hit your initial January targets; it's about evaluating the strategic pivots you made throughout the year because of those KPIs. Reviewing how your team responded to mid-year data—whether you reallocated budget away from underperforming ad sets in Q2 or doubled down on high-converting email workflows in Q3—reveals which optimizations actually moved the needle. Tracking both your final numbers and the tactical changes driven by them gives you a clear, proven playbook for sustainable growth in the coming year.

When reviewing your annual KPIs, evaluate these three elements:

  • Baseline vs. Final Metrics: How close did your actual performance come to your original annual projections?
  • Mid-Year Strategy Pivots: What tactical changes were triggered by performance drop-offs or spikes during Q1–Q3?
  • Impact of Changes: Did budget reallocations, copy refreshes, or channel shifts deliver the intended ROI boost?

Documenting how data-driven adjustments impacted your bottom line ensures you don't repeat past missteps and helps refine your decision-making process for next year's campaigns.

Giving yourself a grade

To bring your end-of-year review full circle, pull out last year’s marketing plan and assign your overall execution an honest, objective grade. Evaluate your initial goals, product launch timelines, and strategic initiatives against actual outcomes rather than vanity metrics. Rating your performance on a clear scale forces your team to take accountability for where execution excelled and pinpoint exactly where campaigns fell short, establishing a realistic benchmark for setting next year's targets.

Next, conduct a line-item audit of last year’s marketing budget to evaluate financial efficiency alongside performance. Compare your projected spend against actual expenditures across ad platforms, hardware and software subscriptions, staff salaries, and content creation. Identify which channels delivered a high return on investment (ROI) versus those that drained capital without converting leads. Evaluating where dollars were under- or over-utilized ensures you trim operational waste, eliminate redundant tools, and reallocate capital into your highest-performing channels for the upcoming fiscal year.

Finally, document and grade your major pivot points—the strategic shifts your team made when original assumptions met market reality. Whether you reallocated ad spend mid-year, adapted to shifting algorithm updates, or launched a surprise campaign to match changing consumer trends, evaluate how quickly and effectively your team adapted. Measuring the financial and operational impact of these mid-course corrections reveals the agility of your marketing engine, ensuring you don't just plan for best-case scenarios, but build a flexible strategy ready for real-world changes.

With your retrospective review complete, you are ready to translate those lessons into ambitious yet data-backed 2027 goals. Rather than setting arbitrary targets, use your historical conversion rates, demographic shifts, and keyword trajectory to establish clear, measurable objectives for the coming year. Whether your 2027 priorities involve expanding into new market segments, lowering your Customer Acquisition Cost (CAC), or driving qualified organic traffic, setting grounded KPIs keeps your team accountable and aligned from day one.

Next, build your 2027 marketing budget using the clear financial visibility gained from your audit. Cut spending on redundant software and underperforming campaigns, reallocating those capital resources into your highest-ROI channels. Be sure to build in dedicated testing allocations for emerging platforms, updated tech stack tools, and a flexible contingency fund for mid-year market shifts. A strategic 2027 budget isn't just a cap on spending—it is an intentional investment roadmap designed to extract maximum value from every dollar spent.

Finally, synthesize your target goals, financial parameters, and audience insights into a unified 2027 strategic marketing plan. Map out your primary campaign themes, quarterly milestones, channel-specific distribution plans, and KPI review cadences for the entire year. Documenting this strategy before Q1 kicks off provides your marketing team with a clear, actionable playbook that balances consistent execution with built-in agility—ensuring you hit the ground running in 2027 ready to drive predictable, scalable growth.

Planning for a successful year shouldn't be a guessing game—or a solo effort. Wrapping up the year with clean data and a sharp strategy gives your business an immediate competitive edge the moment January arrives.

If you're ready to optimize your campaigns, eliminate wasted budget, and build a data-driven roadmap for the coming year, let’s collaborate. Contact us today to schedule your complete strategic marketing evaluation. Together, we’ll evaluate your metrics, refine your positioning, and write an actionable 2027 strategic marketing plan designed to hit your revenue goals.


5 Critical End-Of-Year Marketing Procedures You Can’t Afford To Skip Read More »

Strategic Analytics made simple

How is Strategic Marketing Analytics made simple with Google

Google Anayltics can turn simple reports into actionable ROI (Return on Investment)

Your website is a goldmine of data, but without the right tools, it can feel more like a dusty vault. Google Analytics 4 (GA4) and Google Tag Manager (GTM) collect the crucial Key Performance Indicators (KPIs), but getting them into a format for quick, meaningful analysis and reporting can be a headache.

If your business is on a budget, but your need for analytics isn’t, this is a great way to have a big win for your business, and your budget.

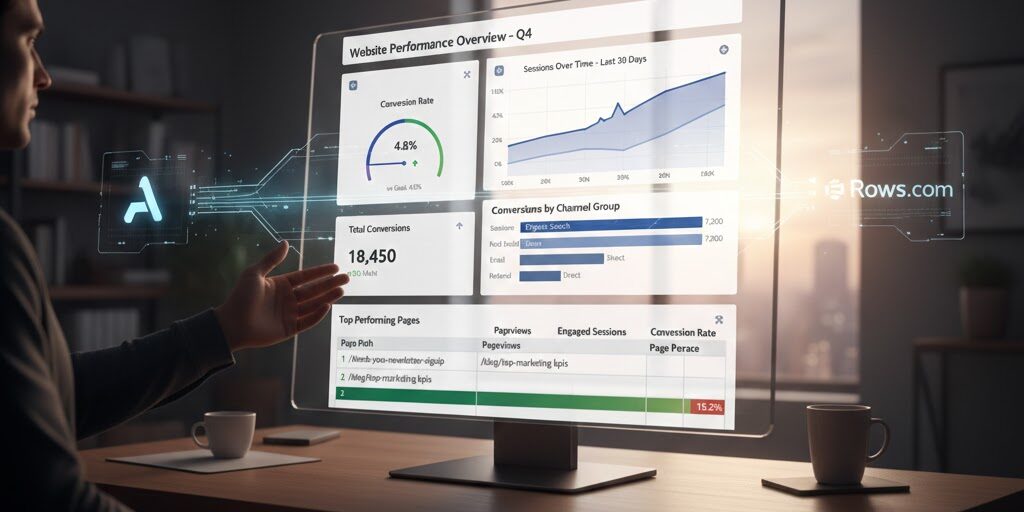
By using some great free/paid tools with your current Google tools such as Analytics and Tag manager. A great new tool you should include in your tools is Rows.com, a spreadsheet creator that connects directly to your data sources.

In this post, we'll walk through a powerful, no-code workflow to pull your KPIs from GA4 (and the GTM-fueled events that enrich it), evaluate them in Rows, and build beautiful, shareable charts.

Defining and Capturing Your KPIs with GA4 & GTM

Before you can chart your data, you need to make sure you're tracking the right things.

GA4 is event-based, meaning every user action—from a page view to a purchase—is an event. GTM is your essential deployment tool for managing these events. If you need help setting up your Google Tag manager and setting up a few events, contact us.

The GA4-GTM Synergy

The Google partnership is so connected that smooth transitions between the two create reports that are nothing short of genius and productive for your marketing growth. GA4 is where your data lives and is processed. It tracks your fundamental events automatically via Enhanced Measurements. Events such as page_view, scroll, and first_visit. GTM on the other hand is your main control center for customizing and tracking events that define your necessary KPIs such as a form submission or a download click. GTM’s triggers and event GA4 event tags are used to push your data into your GA4 property.

For example: You would create a custom event trigger in Google Tag Manager to track your newsletter sign ups, this fires a Google Analytics 4 tag. This in turn becomes the metric you use in GA4.

Now that you have relevant information, you need to have a way to put it in a format where you can read it, manipulate it, and put it in charts.

Retrieving Your KPI Data with Rows.com

Now let’s get started with Rows.com by treating your favorite tools as spreadsheet functions seamlessly connecting your GA4 data. This is a much easier way to pull specific data than navigating the native GA4 interface for exports. Let’s look at this step-by-step.

Step 1: Connect Rows to Your GA4 Account

  1. In your Rows spreadsheet, type = and start typing GOOGLE_ANALYTICS_4.
  2. Select the relevant function, like GOOGLE_ANALYTICS_4.GET_REPORT().
  3. You'll be prompted to connect your Google Account. Grant access to your Google Analytics data.

Step 2: Querying Your KPI Data

The beauty of Rows is the ability to easily construct your query. Unlike a manual export, you define the exact Dimensions (how you slice your data, e.g., Date, Page Path, Channel Group) and Metrics (your KPIs, e.g., Engaged Sessions, Conversions, Event Count) you need.

Formula Component Value/Selection Description
Property_ID GA4-XXXXXX Your GA4 Measurement ID.
Start_Date "30 days ago" A dynamic date range.
End_Date "today" The current date.
Metrics ["sessions", "conversions"] The KPIs you want to track.
Dimensions ["date"] Slicing the data by date.
Conversion_Event "purchase" (Optional) Filter for a specific event.

You'll see a small table appear in your spreadsheet, populated with live data from GA4. Set this table to automatically refresh daily, providing a perpetually up-to-date report.

Evaluating, Manipulating and Visualizing Your KPIs

Now your data is in a flexible spreadsheet environment. You can clean, calculate, and transform your raw data into insightful visualizations. Some uses for this information doesn’t stop at knowing what successes and not-so successes you had with your current marketing but possible new product lines, price points, and demographics.

Performing Calculations and Evaluation

Now you can take strategy to a whole new level by combining metrics.

For example, your Conversion Rate is a much more telling KPI than just the raw number of conversions.

If your Rows data table is in cells A1:C31:

KPI Calculation Formula Example Description
Conversion Rate =C2/B2 Conversions (Col C) divided by Sessions (Col B) on a given row.
Percentage Change =(C2-C3)/C3 Compare today's conversions to yesterday's.
Conditional Formatting Built-in feature Highlight cells red/green based on a defined KPI goal.

Creating Useful Charts

Rows offers intuitive charting capabilities directly from your spreadsheet data. Select your calculated data—for instance, the Date column and your new Conversion Rate column—and insert a chart. These charts can be embedded into your Google sheets (automatically, but takes some coding).

What we learned

By strategically using GTM to define and deploy your KPI-related events, retrieving that rich data with the powerful GA4 connector in Rows.com, and using the spreadsheet environment for easy calculation and charting, you move past manual data exports. You gain a powerful, automated, and easily shareable way to monitor the metrics that matter most to your business.

Recommendation

I would like to thank the people at rows.com for putting up such great tutorials. Most of what you read today came from my notes used to set up content for my own clients.  I started years ago with just Google Analytics and as the years progressed Google has consistently made marketing strategy easier and less time consuming. I use the paid version for myself and my clients, but you can try the free version. The paid version is so affordable though, I would just jump right in.

P.S. Since the writing of this article, Rows.com has started to perfect its own AI. Can’t wait to start using it.

Strategic Marketing Analytics made simple with Google Read More »

Google Marketing and the use in Chiropractic Marketing

How To: Google Marketing with Google Reviews

How useful was this article
★★★★★

In today's digital world, online reviews are king. They hold immense power, influencing where we shop, eat, and even which doctor we see. When it comes to your business, Google Reviews are a goldmine you can't afford to ignore. But why exactly are they so important, and how do you get more of them?

The Power of Positive Reviews

Think of Google Reviews as virtual word-of-mouth recommendations. Potential customers are constantly searching online, and positive reviews act as a glowing endorsement, building trust and credibility for your business. Here's how they benefit you:

  • Increased Visibility: Businesses with more reviews tend to rank higher in Google searches. This means more potential customers will see your listing, leading to more website traffic and footfall.
  • Boosted Sales: Studies show that customers are more likely to choose a business with positive reviews.
  • Builds Trust: Positive reviews showcase happy customers, giving potential customers confidence in your brand.
  • Improves Customer Engagement: Responding to reviews (both positive and negative) shows you care about customer feedback and fosters a sense of community.

How to Encourage Google Reviews

Now that you know the power of Google Reviews, let's explore how to encourage customers to leave them:

  • Make it Easy: Include a "Leave a Google Review" button on your website and social media pages. You can also create a custom Google review link to share directly with customers.
  • The Right Time: Don't be shy about asking for reviews! The ideal time is right after a positive customer interaction, like a completed purchase or resolved issue.
  • Respond to All Reviews: This shows you value customer feedback, good or bad. Address negative reviews professionally and offer solutions. Thank customers for positive reviews and highlight specific details they mentioned.

Building a Strong Online Reputation

Google Reviews are a powerful tool for building a strong online reputation for your business. By understanding their importance and implementing these strategies, you can encourage more customers to share their positive experiences, leading to increased visibility, trust, and ultimately, more success for your business.

Here are a few of our suggestions:

If you offer your customers a bottle of water, put a QR code on it and stick it on every bottle.

Put business sized cards on the reception desk with a QR code.

Put links on your social media, and so much more.

Jumping into Google Business

Let's take a moment and jump into Google Business. When you have a local business you want to build a local community. Today let's just look at a few things that are new that can help you build your community.

I assume you have a Google Business profile, now called Google Maps. You can find a direct link inside of your Google account.

Finding Google Business in your Google Account. Build your chiropractic marketing with marketing health academy

Google Business inside your Google account


Google Marketing with Google Reviews Read More »

Feeling lost in the marketing maze? This blog post is your guide to crafting a winning marketing strategy.

Crafting A Pathway: A Guide to Building Stategic Marketing

Designing your step by step to success

How Useful was this Article
★★★★★

In today's dynamic business environment, having a clear direction is critical to success. This is especially true in the field of marketing, where competition is stiff and audience attention spans are short.. That's where a well-defined guide to Strategic Marketing comes in – your roadmap to navigating the ever-changing marketing terrain. Understanding the rules to a detailed action or an overall plan use essential tools with The Marketing Circle.

What is a Strategic Marketing?

Think of your strategic marketing as a comprehensive plan outlining how you'll achieve your business goals through marketing efforts. It is more than just promoting your products or services; it also includes identifying your target audience, producing a captivating message, and determining the most successful means for reaching them.

Why is a Strategic Marketing Important?

Here are just a few reasons why a well-defined guide to marketing strategy is essential:

  • Clarity and Focus: It provides a detailed pathway, keeping your marketing efforts aligned with your overall business objectives.
  • Efficiency: It helps you allocate resources strategically, avoiding scattered efforts and maximizing return on investment (ROI).
  • Measurable Success: By establishing clear goals and Key Performance Indicators (KPIs), you can track progress and measure the effectiveness of your marketing initiatives.
  • Competitive Advantage: A strong strategy helps you differentiate your brand and stand out from the crowd, attracting and retaining customers.

Building Strategic Marketing:

Crafting a winning marketing strategy involves several key steps:

  1. Define Your Goals: What do you want to achieve with your marketing efforts? Increase brand awareness, generate leads, or boost sales?
  2. Know Your Audience: Who are you trying to reach? Understanding their demographics, needs, and pain points is crucial for crafting relevant messaging.
  3. Competitive Analysis: Research your competitors, their strengths and weaknesses, and how they position themselves in the market.
  4. Develop Your Value Proposition: What makes your brand unique and valuable to your target audience? We call this “Becoming the Expert”
  5. Choose Your Marketing Channels: Identify the channels where your target audience spends their time, be it social media, email marketing, content marketing, or a combination of these.
  6. Craft Your Message: Develop compelling messaging that resonates with your audience and highlights your value proposition.
  7. Set Measurable Goals and KPIs: Define specific, measurable, achievable, relevant, and time-bound (SMART) goals to track your progress.
  8. Monitor and Adapt: Regularly analyze your marketing performance and adapt your strategy based on the data you gather.

Remember: Your strategic marketing is not static. As market trends evolve and audience behavior changes, so should your strategy. Continuously monitor, analyze, and adapt your approach to ensure lasting success.

By investing time and effort into crafting a strong marketing strategy, you can increase your chances of achieving your business goals and navigating the ever-changing marketing landscape with confidence.

October 2026
S M T W T F S
 123
45678910
11121314151617
18192021222324
25262728293031

Crafting A Pathway: Guide to Building Strategic Marketing Read More »

Demographics for Strategic Marketing

How Do I Use Demographics for Strategic Marketing

Using your KPI's and analytics you can grow your customer base by targeting demographics and finding products that relate. KPI's are very valuable when tracking down your demographics for new customer targeting and increased sales.

Beyond Basic Demographics: How to Target Your Perfect Customer

What Are Your Demographics? According to Oxford Reference, demographics are the statistical characteristics of a population, such as age, sex, family size, and income. While this is a perfect technical definition, applying it to your small business requires a more practical approach.

Consider the demographic of "age," for instance. Simply knowing someone's age isn't enough to determine if your service is right for them. A 30-year-old athlete with a sports injury and a 30-year-old pregnant mother fall into the exact same age bracket, but their lifestyles and needs are vastly different. This is where we cross over from demographics into psychographics—the study of your audience's behaviors, lifestyles, and pain points.

To reach your ideal customer effectively, you must match your service's specific benefits to their unique situations. This is the foundation of benefit marketing: aligning your services with the exact problems they solve for specific people. Because of this, defining your target audience's demographics and psychographics should always be step one when building out your three-month, six-month, and one-year strategic marketing plans.

The Power of Benefit-Driven Marketing

How you approach benefit marketing depends slightly on whether you sell a service or a physical product.

For Service-Based Businesses

If you are a service-based business, your "product" is ultimately the action you take to solve a customer's specific problem. With that in mind, can you list your offerings based on their distinct features and benefits?

  • Identify Your Assets: Does your company utilize specialized equipment or proprietary technology for a particular service? That serves as both a feature and a benefit.
  • Identify the Beneficiary: Who is the ideal customer to benefit from this specific asset?

When you equip yourself with strategies tailored to your unique business, you can determine exactly which demographic details are necessary to track. If a certain age or location is important, you can then find the best marketing tools to capture that data.

For Product-Based Businesses

When selling a physical product, the marketing actions are similar, but you must account for an additional dynamic: Who will be using the product vs. who will be purchasing it?

A great example is a children's toy. The child is the end-user, but the parent holds the wallet. Your marketing must visually intrigue the child while simultaneously displaying the core benefits (safety, education, durability) that convince the parent to make the purchase. This dual-layered approach often relies heavily on emotional marketing techniques and price-based positioning.

Gathering Your Data (Without Getting Overwhelmed)

You likely already have access to a wealth of customer data through built-in analytics on platforms like Google, Facebook, Instagram, LinkedIn, and X. Rather than getting overwhelmed by numbers, start with the platform where your audience is most active and that fits your team's technical skill level. These insight reports are goldmines for pulling specific demographic details like age, income, location, and online behavior.

To get the complete picture, combine these three crucial pieces of information:

  1. Your Analytics: Who is currently engaging with you online?
  2. Market Trends: What are people actively searching for right now? (Free tools like Google Trends are great for this).
  3. Your Service Benefits: What specific problems does your business solve better than anyone else?

By cross-referencing your audience analytics and current search trends with the actual benefits your business provides, you can draw a precise map of who to target and where to reach them.

The Bottom Line When you fill out the demographics section of your marketing plan with this level of detail, the next steps—creating content, designing ads, and running promotions—practically write themselves.

Take the time now to do the research, clearly define your benefits, and put all the puzzle pieces together. Good luck! And as always, if you need help getting started, Marketing Health Academy is here for you.

What specific service or product are you currently trying to market, so we can brainstorm its core features and benefits together?

October 2026
S M T W T F S
 123
45678910
11121314151617
18192021222324
25262728293031

Tips on Demographics for Strategic Marketing Read More »

Scroll to Top